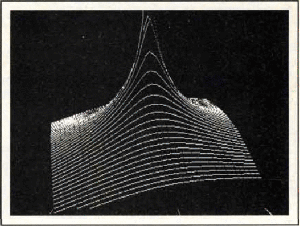
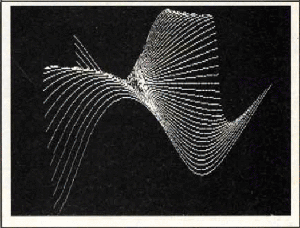
A M Baldwin's Surfaces program follows on from this new tradition by creating visual images of such mathematical functions as 5*(x/y+x)+EXP(-x*Y).
It achieves this by using Larry Simon's Plot routine (which is included in the listing - so you've got it yet again), first printed in issue 23 (raw sold out) and updated last month.
The image produced consists of a series of graphs drawn one behind the other.
The program then turns your PCW into a kind of roving microscope allowing you to view the image from some startling perspectives.
For example you can look down from 'on high' or even delve around inside the shape.
To do any of this you'll need to provide values for the variables listed below:
FNz: here the variable z represents the model function from which the drawing is taken.
Changing the sign within the function changes the perspective.
Signs such as COS or SIN will provide a wider view but some interesting distortions can also be obtained.
ed: this stands for Eye Distance.
The greater the value assigned to ed the further your 'eye' is from the image.
This creates a smaller, less detailed picture on the screen. Setting ed at 100 will normally give a good overall view of any shape; you can then pick areas to examine more closely.
sf: this stands for Scaling Factor.
A more apt description might be magnification.
The greater the value, the higher the magnification and the larger the image.
A scaling factor of between 400 and 900 will produce reasonable detail, but as usual you should experiment.
st: this stands for STEP and is used with the FOR...NEXT loops throughout the program.
st actually provides the area to be magnified.
Setting st at 0.1 will give a fairly clear image quickly.
A setting of 0.5 combined with an ed setting of 100 should give a good general sketch.
A small value for st gives a small area to be magnified.
ax and az: these give the angles from which you view the shape.
ax gives the up (high value) and down (low value).
ax=0 is directly 'above' the image while ax=90 is 'ground level'.
az, on the other hand, rotates the image.
az=90 views the image 'straight on'.
Anything above 90, or the use of negative numbers, will produce very little on the screen.
In order to change the values assigned to any of these variables you need to edit the relevant lines before running the program.
You will probably find that this constant stopping and starting becomes a pain.
A quick glance at the
INPUT command in the Mallard Basic manual should provide you with a more convenient method ot assigning values.
The program, as it stands, is an impressive piece of work.
It makes imaginative use of the Plot routine but it could always be modified.
For example, might there be a way of having several shapes on the screen at once?
Would it be possible to elongate or even crunch shapes?
Why not try to answer these questions and when you've done that, send the solutions into us.

|
| This was produced by the listing you are about to type in. |

|
| A few minor changes to the values of ed and and ax/az will produce this 'wave farm'. |