|
Im Magazin „8000 PLUS" wurde im April 1989 der folgende Artikel abgedruckt.
|
Ein BASIC-Programm zur Berechnung der Mandelbrot-Menge
|
|
|
MANDELBROT PLOT
by Brian Aird
|

|
|
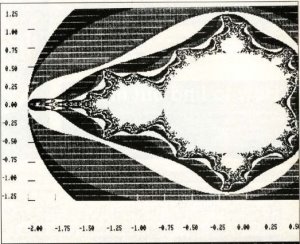
As you can see from the picture of the complete set the range of values for the x and y co-ordinates is quite small, and these have to be scaled up to the 720 by 255 of the PCW screen
|
When you hear people speak of the beauty of mathematics they are usually referring to a purely cerebral phenomenon, but in the singular case of fractals the beauty is one which we can all appreciate.
Probably the most famous fractal of all is that generated at the edge of the Mandelbrot set, a unique, almost organic series of shapes that plummets, unresolved, to the realms of the infinitely small.
It is precisely this uncertainty at the boundary that provides the fascination of the Mandelbrot set.
It somehow defies common sense to believe that no matter how much you magnify the edge (by examining ever smaller areas) it will never resolve into a definite boundary, it will always be possible to magnify the resulting tiny areas still further and produce new, equally complex, patterns.
In fact the limits are imposed not by nature but by the minimum size of number with which our computers can work, and the speed with which they can perform the necessary calculations.
The basic formula used to produce these numbers is extremely simple.
The reason it takes so long is that it has to be iterated over and over again to find out whether or not the number belongs to the Mandelbrot set or lies outside it.
For some numbers this takes only a few iterations, for others it can take hundreds of millions of iterations.
Since it's necessary to limit the number of iterations performed on any
particular point to some reasonable limit (in order to get a result while you're still alive to see it), you can only ever achieve an approximation of the true shapes;
however, this is still extremely pretty.
The formula used by Mandelbrot was simple;
it's z = z*z + c which is iterated a certain number of times.
If z becomes infinitely large then it isn't a member of the set, whereas if it stays finite then it is.
In practise it is found that if z becomes greater than two then it will probably become infinite, so normally z <= 2 (less than or equal to two) is the limit tested for.
It is near the edge of the set, where an enormous number of iterations are required to decide whether or not a particular point falls within the set that provide the uncertainty, and the patterns.
In fact only by performing an infinite number of iterations can it be decided if certain points belong in the set, and clearly there isn't time for an infinite number of calculations so we can never finally define the edge.
Strange equations
Now, you've begun to suspect that there must be something strange about this little equation (z = z*z + c), and there is:
both z and c are complex numbers.
An example of a complex number is the square root of -1.
Since any number multiplied by itself produces a positive number it's hard to write it any other way, and furthermore if you try to resolve the sum 3+(square root of -1) it's difficult to see how else to write it, and in fact you can't;
a complex number thus has to be written in two parts.
In line with this idea the complex number z is treated as a + jb, where j is the strange part (called the imaginary component).
By taking a as the x co-ordinate and b as the y co-ordinate we can plot a point on the screen, and to decide what we plot it's necessary to work out the value of z.
If this value stays below 2 then we leave the location blank, otherwise we plot to it.
So how do we actually calculate this value?
The answer is in geometry.
The value we want is the length of a hypotenuse of a right angled triangle with sides real(z) and imaginary(z) so we can use Pythagoras' theorem to solve it:
value (z) = square root(real(z*z) imaginary(z*z)).
As you can see, this calculation is performed in line 260.
How to use the listing
This program makes use of Lawrence Simons' plot and screensave routines.
First you need to type in the Mandelbrot listing (call it something like mandle.bas) and then the other programs have to be merged with it.
The plot routine is in
issue 23 (August 88) and as explained at the time you only need the lines from 50000 onward - don't include the rest or they will overwrite the Mandelbrot listing.
The other routine required is also by Lawrence Simons (thanks again Lawrence - we love you) and appeared in
issue 28 (January 89) with four missing lines appearing in issue 29 (February 89).
You must only use the lines from 54000 onwards and merge it with the rest of the program.
If you don't have these issues, shame on you, contact the Old Barn at Somerton (see the contents page for the address).
Once you have the three parts of the program assembled - make sure you save a complete version before running it - simply type run and follow the prompts.
First of all you will be asked it you want to Save or Load.
Type in S or L.
Obviously you can't load any pictures until you've generated them so type S.
What you are asked for next are two numbers on the x axis and two on the y axis (remember, x is across and y isn't).
The range of numbers you can use are shown on the picture of the complete set and the area thus defined is what will be displayed on the screen.
Once you've provided the numbers you'll be asked for the number of iterations;
the bigger this number is the better the detail will be but the longer it will take to draw.
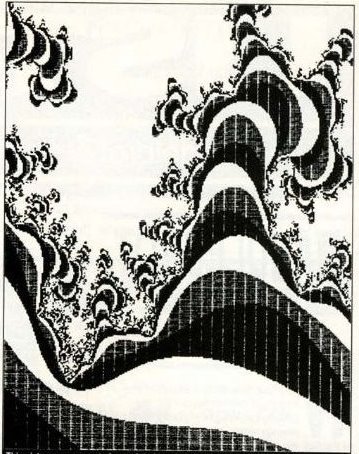
The pictures you see here were generated overnight using 40 iterations.
The final piece of information is the name of the file the picture will be saved to.
This allows you to build up a library of images of the Mandelbrot set which you can use to brighten up programs and amaze your friends.

|
How to find out more |
The Mandelbrot set was discovered by Bertoit Mandelbrot, an IBM Fellow at the Thomas J Watson Research Centre.
This listing originated from information in an article in Scientific
|
American, August 19S5 by A K Dewdny.
The recent Byte magazine, November 1988, contains relevant material on building a Mandelbrot engine by Steve Ciarcia.
|
|
 |
|
This picture was generated overnight by examining the Mandelbrot set between coordinates x = -0.75 to x = -0.7 and y = +0.25 to y = +0.3 with T% = 40
|
|
|
|
Explanation of the program function.
|
|
|
|
Initialising the program.
Line 70 calls the rouline that sets up the Screensave routines
|
|
|
|
It you're going to save a screen then it has to be created.
This part of the program picks up all the variables and then sets up the plot routines.
|
|
|
|
All the actual work is done here.
The calculation occurs in the line 260, the scaling to fit the screen is done in line 210.
If you've seen colour pictures of the Mandelbrot set you may have wondered now the colours are decided;
in fact all that happens is that a colour is assigned to a particular point depending on how many iterations it took to go out of range.
The best we can do on the PCW is plot points differently depending on how fast they go out ot range.
This is done in lines 280 and 290.
|
|
|
|
This final section of the program is responsible for actually calling Lawrence Simons screen Load Save routines
|
| [Komplettes BASIC-Listing,
Assembler-Plot-Listing und
Assembler-Screensave-Listing] |
HTML-Bearbeitung von
Werner Cirsovius
Dezember 2014
© 8000 PLUS


