|
The following article was printed in October 1988 of the magazine „8000 PLUS".
|
|
GSXPLORATION DIY graphics in BASIC for free! Charles Pulteney unravels some of the mysteries of GSX in the first of two features |
|
GSX stands for Graphical Systems Extension and is a piece of software supplied free with all PCWs.
The only problem is knowing how to use it, as documentation is almost non-existent.
Yet Mallard BASIC can be used to call the facilities available in the PCW version of GSX.
Although the screen output of the PCW version of GSX isn't so good, the printer output (for dot-matrix printers only) is really impressive and is capable of producing high quality graphs, bar charts, pie charts, sketches and letter headings.
|
J14CPM3.EMS (the number may be slightly different, eg on a 9512 it is J21CPM3.EMS - check by taking a directory with DIR); BASIC.COM; DDHP7470.PRL; DDFXLR8.PRL; GENGRAF.COM; DDSCREEN.PRL; ASSIGN.SYS; DDFXHR8.PRL; and GSX.SYS are needed.
GENGRAF BASIC.
The GENGRAF copyright sign will appear and after a while the A> prompt will return.
To avoid confusion with ordinary BASIC, rename this GSX version by typing REM GBASIC.COM=BASIC.COM.
GBASIC you should see the GSX-80 copyright sign followed by the one for Mallard-80.
Note that there are only 17k free bytes, ie. less than normal.

SAVE "UTILITY.GSX".
SAVE LISTING2.GSX and when finished MERGE UTILITY.GSX.
The utility you typed earlier will be tacked on and you can use the functions of the utility. If you now RUN you should be presented by a three choice menu.
If you made errors while typing the first utility, they will be picked up by the ON ERROR GOTO sub-routine (if this should happen make the relevant amendments and type: SAVE "UTILITY.GSX" and run the program again).
Select 1 (Screen Output).
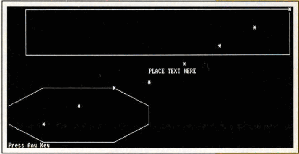
You should see the box, the text, the polygon and the markers being drawn on the screen.
|
Line 10010 draws a hollow rectangular box whose lower left co-ordinate is 5, 55 and whose upper
right co-ordinate is 80,80.
Line 10020 draws a line ff text with the base of the first character at 40, 45.
Lines 10030-10080 draw an eight sided polygon with a vertical hatch fill (which you will not be able to see on the screen).
There are two points to notice here.
Use of the RESTOR/READ/DATA commands is the simplest way to enter a large number of co-ordinate values.
In line 10080, the first two items are the co-ordinates for x1, y1 , the next pair x2, y2, and so on.
The polygon GOSUB is Ihe only one in which the data is ascribed directly to the pts.in% array.
Note also that when using the polygon GOSUB, the final co-ordinate must he the same as the first one.
In other words, you must finish where you started!
It is for this reason that in this case the number of points (np%) is 9 and not 8.
The RESTORE/READ/DATA commands can also be used to simplify data entry for the other GOSUBS.
Lines 10090-10110 draw 8 markers on the screen at the co-ordinates specified in line 10110.
| ||
|
BASICHelp noteTo copy those files: run CP/M and at the A> prompt type PIP [RETURN].
At line asterisk type M:=A:BASIC.COM [RETURN] ana so on for each lite in the list.
Insert your blank formatted disc
and type A:=M:*.* [RETURN].
8256 owners must copy the files in two stages as there is not enough room in Drive M to hold them all.
For 8256 or 8512 users insert the appropriate side of the systems discs before copying.
J14CPM3.EMS and BASIC.COM are on side 2, DDHP7470.PRL on side 3 and the rest on 4.
|
|
Notes 1
The order in which you place your statements in relation to their final position on the paper is not important.
GSX will process your instructions in the correct order.
Also, the screen does not display fill characteristics, while only one text size, text direction and polymarker size are shown.
The first 5 polyline styles will be drawn.
Locomotive Software sell an improved screen driver which displays fills.
|
|
Notes 2
Most of the output in draft and high quality modes is similar.
The two exceptions are character height and marker size (for draft, double the sze% and hgt% values in the opposite table).
Draft quality is most useful tor checking that the right fill patterns have been selected.
|
BASICNotes 3
It is best to keep text and drawings away from the edges of the available space.
Also, the variables controlling text height, text direction, fill etc. are always returned to the default settings whenever they are used.
You therefore need to reset these values whenever you want to reuse a function.
|
| [BASIC listing] [The machine code in lines 9010-9030 is: LD D,B ! LD E,C ! LD C,73 ! JP 0005]
|
|
Notes 4
GSX expects to find the drivers (the .PRL files) on every disc.
This waste of space can be avoided by changing the ASSIGN.SYS file. Using RPED, replace each @ with M.
GSX will then expect to find these files on Drive M, so be sure to copy them there from your startup disc first.
If you have no plotter remove the reference to DDHP7470.PRL in ASSIGN.SYS and delete this PRL file from your disc.
Unless you reset the PCW, it is impossible to stop the printer once output has been sent to it!
|
| The GRAPHPAP.GSX listing. When tacked on to UTILITY.GSX this will produce graph paper which you can use to plan out your graphics. |
HTML customization by
Werner Cirsovius
February 2015
© 8000 PLUS